Forest biomass intelligence, agentically.
FRED turns statewide spatial data and biomass supply models into procurement decisions you can ask for in plain language. Grounded in physics. Routed through an agent.
Six things FRED does, defensibly.
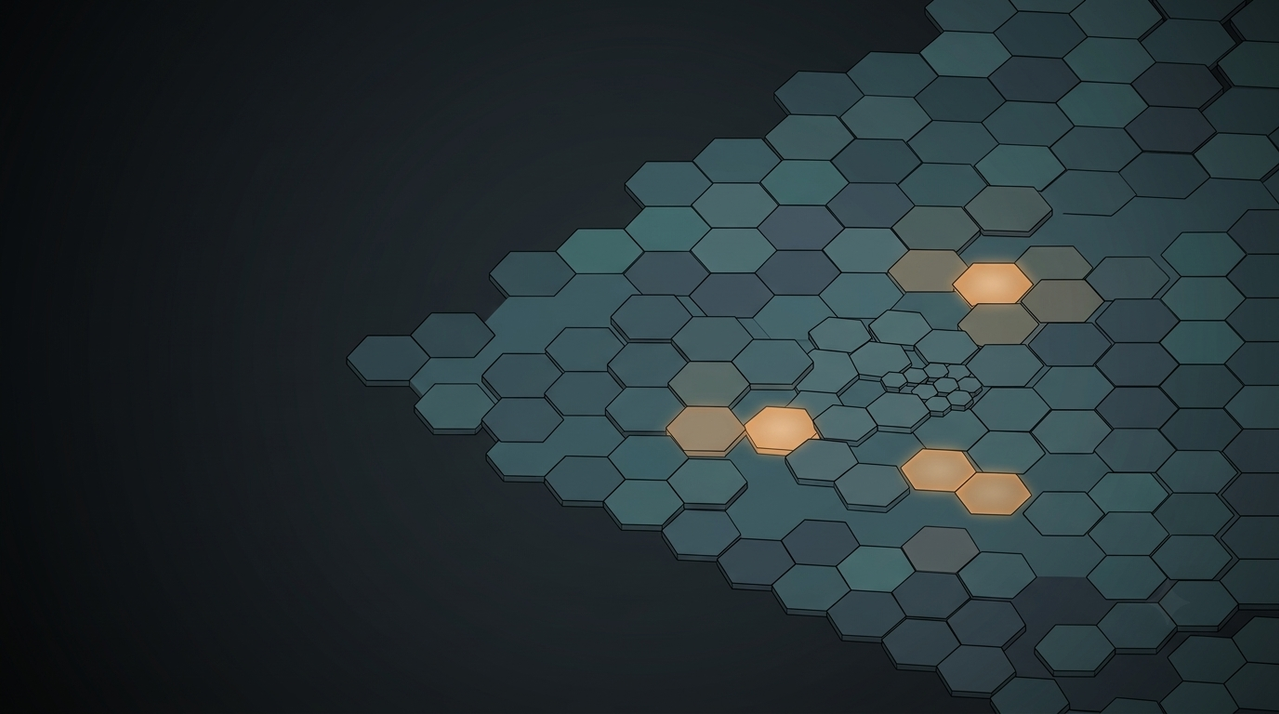
Statewide coverage
3.1M harvest clusters indexed across California with biomass, terrain, and fire-risk attributes.
Procurement radius sweep
Place a facility. The analysis resolves cluster supply in under a second, animated for clarity.
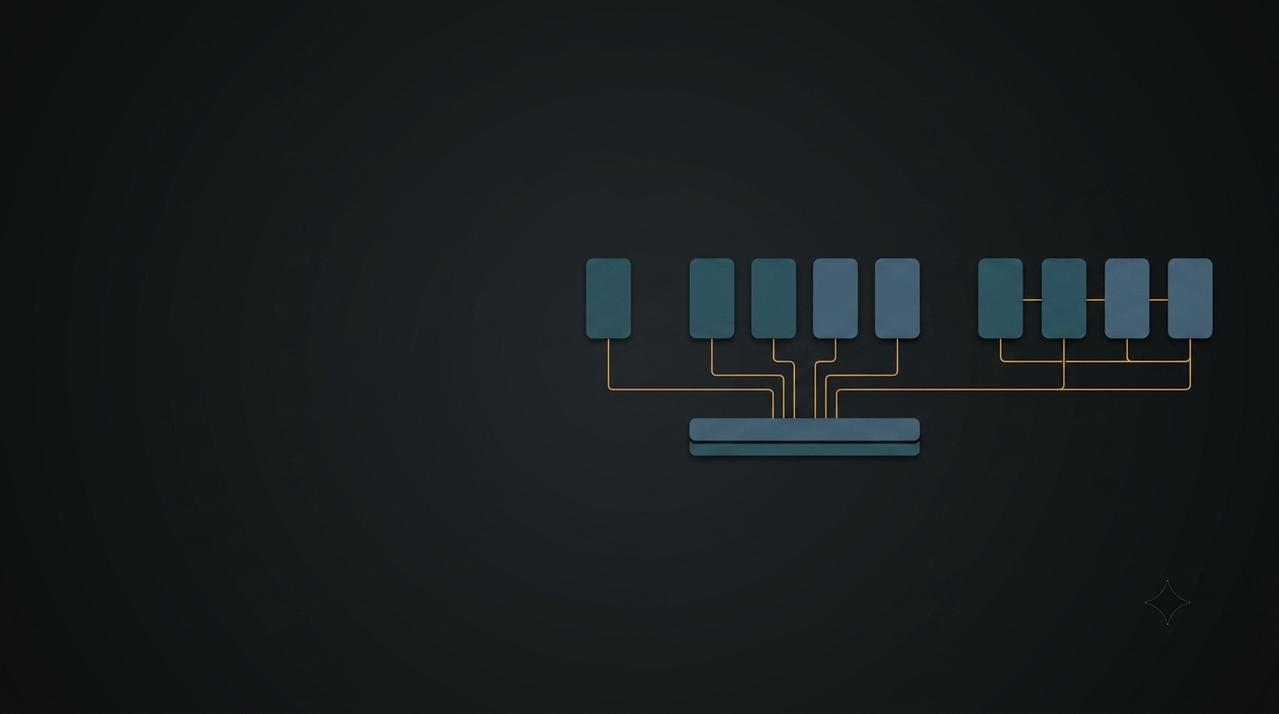
Multi-year projection
See exactly which clusters get harvested in each year as radius expands and biomass depletes.
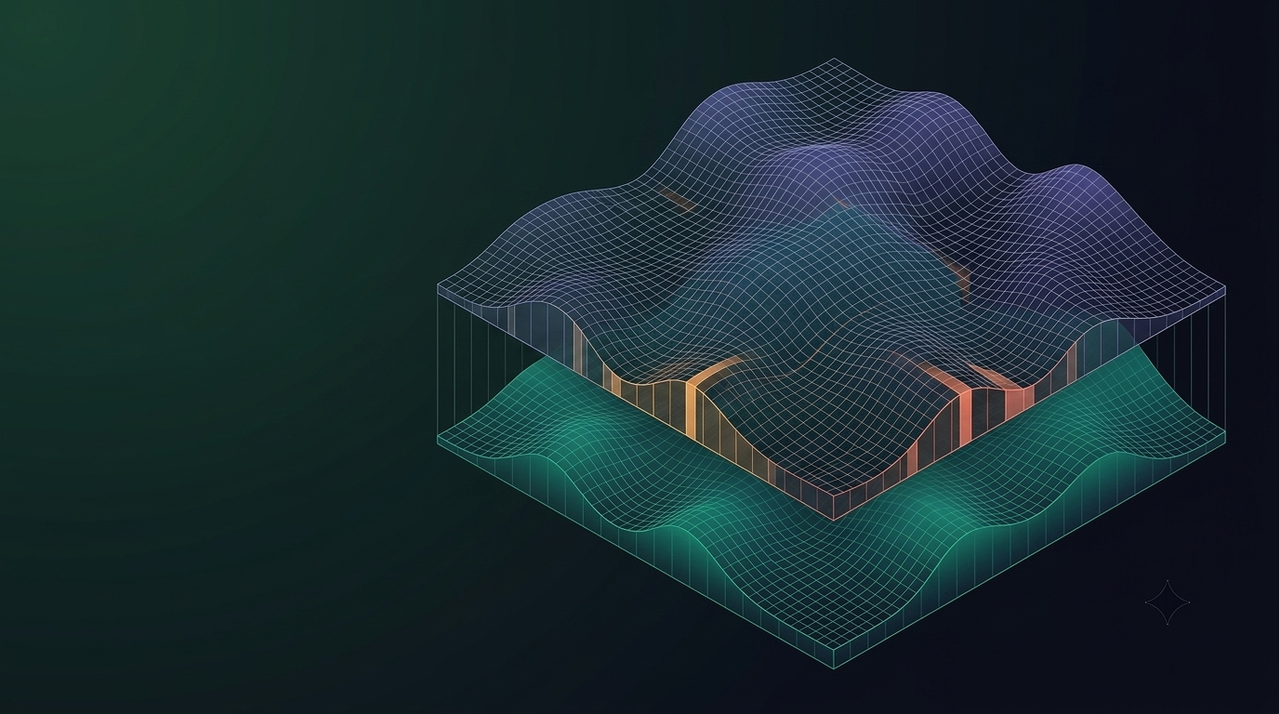
Pareto-frontier optimization
A 5% fire weighting delivers 6.9x leverage in risk reduction per unit cost premium.
Compositional Spatial RAG
Agent routes queries through three prediction layers with tool-level deterministic caching.
Streaming reasoning
Every tool call, every parameter, visible as the agent works. No black boxes.
How FRED works.
Tell FRED where to look
Click anywhere on the map, describe a region in plain language, or simply ask FRED for a recommendation. FRED identifies candidate sites, resolves county and watershed boundaries, and initializes the spatial procurement radius automatically.
"Find biomass supply within 75km of Shasta County, prioritizing fire risk reduction."
"Where should I build a 10MW facility in Northern California?"
"What's the biomass situation in Plumas County?"
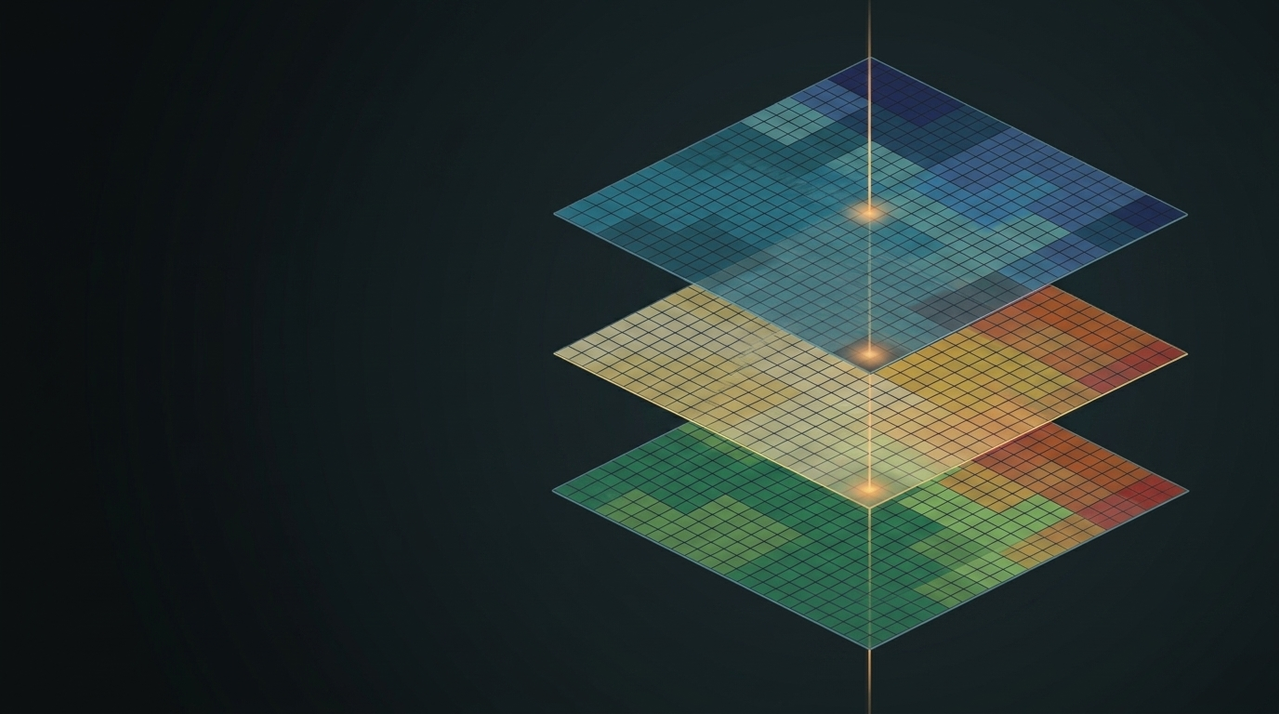
CS-RAG composes prediction layers
The Compositional Spatial RAG engine retrieves heterogeneous ML prediction layers including harvest cost, transport circuity, and fire burn probability, then computes domain-specific metrics on the retrieved spatial data before synthesizing recommendations.
Get procurement-ready recommendations
FRED synthesizes tradeoffs across cost, fire risk, and supply availability into plain-language recommendations with interactive multi-year supply projections and exportable cluster maps.
"At alpha=0.05, this facility can source 42.3k BDT/yr at $87.40/BDT with a 6.9x fire risk reduction leverage. Expanding radius to 90km adds 18k BDT/yr at a 12% cost premium."
Watch it think.
Where should I put a 10 MW facility near Redding, and what will the feedstock cost?
- Looking up location coordinates(Redding, CA)0.4s
- Calculating biomass demand(10 MW, GPO)→ 78,840 BDT/year0.6s
- Estimating procurement radius(40.586°N, 122.392°W, 78,840 BDT)→ R* = 84 km1.8s
- Retrieving forest clusters(84 km radius)→ 2,184 clusters2.4s
- Building supply curve(78,840 BDT, α=0.95)→ 1,976 selected, $87.40/GT0.9s
- Analyzing fire-cost tradeoffs1.1s
A site east of Redding clears 10 MW inside an 84 km radius. At alpha = 0.95, which puts 5% of the objective on fire risk, 1,976 clusters deliver 78,840 BDT/yr at $87.40/GT. That 5% given up on cost buys 6.9x more risk reduction than it costs. Widening to 100 km adds roughly 14k BDT/yr at a 9% premium.
The radius, the alpha, the demand. Nothing the agent chose is hidden behind a summary.
Six tool calls, 7.2 seconds. A step that reuses a cached result says so by finishing in milliseconds.
The answer is assembled from the results above it, and each one is a tool you can call yourself.
The research behind FRED.
Questions, answered.
Do I need to pay to use FRED?
FRED is free and publicly accessible for research and planning purposes. We ask that users create an account to help us understand our user base and gather feedback for improvement.
Is FRED open source?
Yes and no. The underlying CS-RAG architecture is open source and available on GitHub. However, the FRED application itself is not open source due to dependencies on proprietary datasets and security considerations around the agent tools.
Can I use FRED outside California?
The current deployment is California-only because it depends on the C-BREC dataset and USDA FSim rasters scoped to California. The CS-RAG architecture is region-agnostic and can be extended with equivalent regional data layers.
How do I cite FRED in my research?
Check out the "Docs" section of the website for citation guidelines and references.
Is there an API?
Not yet. We're currently working on API documentation and endpoint availability.
Who is behind FRED?
FRED is built by a small cracked team at 8W Research.
How can I contribute?
We welcome contributions in the form of feedback, bug reports, and code contributions to the CS-RAG architecture. Please reach out via email listed on the website to get involved.